What Economics Quiz measures
This quiz does not pick stocks, file taxes, or replace your instructor's problem sets. It measures how much you agree with introductory economics literacy grouped four ways: scarcity and tradeoffs about limited resources, opportunity cost, production possibilities in simple models, and specialization gains in textbook stories; supply and demand about laws of demand and supply, equilibrium, shifts versus movements along curves, and basic price quantity stories on one graph; macro and micro basics about scope differences, GDP as final output language, inflation as overall price level change, and unemployment as labor force seeking work in intro headlines; and study not finance advice about rejecting meme certified hedge fund fantasies, looking up graph help, and separating classroom definitions from hot takes online. You answer 22 statements from strongly disagree to strongly agree, with reverse worded traps so agreeing with every shortcut cannot inflate every bar. Your answers also feed a second chart on closeness and trust habits, because debate clubs sometimes reward loud certainty over checking definitions. The total becomes an index from 0 to 100 where higher means more reported economics literacy on this screener, not proof you should manage anyone's money.
Scarcity and tradeoffs
Limited resources, opportunity cost, production possibilities, and specialization in intro language.
Supply and demand
Laws of demand and supply, equilibrium, shifts versus movements, and basic market diagrams.
Macro and micro basics
Scope split, GDP, inflation, unemployment headlines, and aggregates versus single markets.
Study not finance advice
Classroom literacy only, graph help habits, and no treating bars like trading credentials.
How it works
Answer 22 agreement items
Rate each statement from Strongly disagree to Strongly agree. Tap Next after each answer.
Answers sort into four domains
Each answer feeds one of four economics groups, and every item also feeds a closeness and trust layer.
See your index and charts
You get a 0 to 100 index, a band, and two bar charts you can use before the next unit quiz.
Take the Economics Quiz
Answer 22 short statements to see your intro economics literacy index, four domain bars, and a closeness and trust chart.
What your result means
Your index is the average of all 22 answers, scaled from 0 to 100, with reverse worded items flipped first. Higher means more reported economics literacy on this screener. Read supply and demand and study not finance bars together before you treat the total as finance expertise.
| Band | Index range | Typical reading |
|---|---|---|
| Building economics literacy | 0 to 35 | Fewer agreed facts on scarcity, supply and demand, macro anchors, or study limits on this screener. |
| Mixed economics literacy | 36 to 65 | Solid habits in some domains with traps on scarcity, curve shifts, or finance hype. |
| Strong economics literacy | 66 to 100 | Frequent agreement with scarcity, supply and demand, macro anchors, and study limits on this screener. |
Tips at a glance
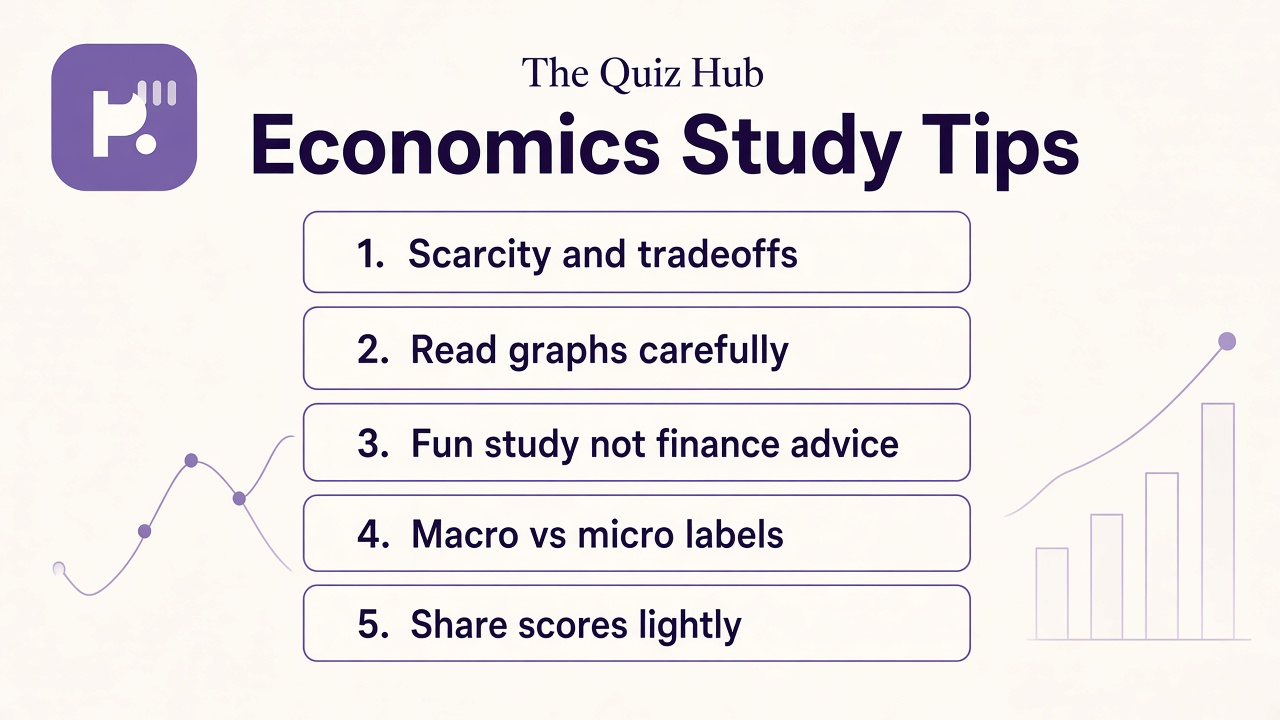
A quick takeaway graphic with topic tips (not your personal quiz scores). Start the quiz for your index, bands, and charts.
What this quiz can and cannot tell you
Can tell you
- Clarify intro scarcity, market, and macro vocabulary in plain language
- Highlight supply and demand graph habits worth checking before exams
- Separate micro unit stories from macro headline definitions
- Give you a retake baseline during an intro economics course
Cannot tell you
- Recommend investments, tax strategies, or business loans for your situation
- Replace instructor feedback on elasticity, welfare, or advanced models
- Cover every subfield, such as econometrics, development, or international finance tracks
- Prove you will never confuse shift and movement under timed exam pressure
Economics literacy beyond headline dunking
Students search economics quizzes when scarcity slides appear the same week news anchors say GDP in one breath and inflation in the next. Intro literacy is about shared definitions: scarcity is not pessimism, it is the reason choice exists. Opportunity cost is not guilt, it is the name for the next best option you skipped. Production possibilities sketches are simplified, yet they still teach tradeoffs when technology and resources are held fixed for one diagram.
Supply and demand graphs are spatial habits. Demand slopes down in the usual ceteris paribus story because higher prices discourage some buyers. Supply slopes up because higher prices encourage some sellers. Equilibrium is where quantities match at a price on that cross, not wherever a comment thread feels angry. Shifts move whole curves when income, tastes, input costs, or technology change in the model; movements along a curve often trace a price change for that good. Agreeing that curves never shift is a trap meant to catch autopilot agreeing.
Macro and micro share scarcity language but ask different questions. Micro often zooms into one market, one firm, or one household choice. Macro often tracks totals like output and average prices and talks about unemployment as labor force job seeking in textbook headlines. GDP counts final production in a period in intro wording; it is not a happiness score. Inflation refers to broad price level change over time, not your grocery bill on a sale weekend alone.
Dr. James Whitfield reviews iq cognitive study screeners with a simple split: reward honest agreement with classroom definitions and honest limits on finance hype at the same time. Study not finance items reject meme certified trading fantasies and keep graph lookup habits visible beside feeds that reward hot takes. Real learners mix bars. You might score high on tradeoffs while keeping macro headlines fuzzy, which often means you think clearly about personal choices before aggregate definitions click.
Use this screener as a warm up, not a verdict. Pair it with one labeled graph from class and our double entry accounting quiz when you want bookkeeping literacy without repeating every econ stem here. The economics chapter 5 quiz sibling aligns with many syllabi that isolate one textbook unit. Browse the IQ and cognitive test hub for more low stakes study games. Retake after you explain one shift to a friend; literacy grows when curves become labeled pictures, not when you memorize that equilibrium starts with e and hope exams follow on test day.
| Test | Focus |
|---|---|
| Double entry accounting quiz | Debits, credits, and journal entries, not scarcity or supply and demand graphs |
| Economics chapter 5 quiz | One textbook chapter unit when your syllabus names chapter five explicitly |
Economics Quiz FAQ
What does Economics Quiz measure?
It measures how much you agree with introductory economics literacy across scarcity and tradeoffs, supply and demand basics, macro and micro anchors, and study not finance limits. You get an index from 0 to 100 and four bars. It reflects self reported habits on this screener, not a course grade or finance license.
Is this investment or tax advice?
No. It builds intro vocabulary and graph habits for study practice. Licensed professionals handle portfolios, taxes, and business planning beyond this screener.
Why do some statements sound like common mistakes?
Reverse worded traps catch shortcuts. Agreeing that free goods erase scarcity, that curves never shift, or that internet quizzes certify hedge funds should not inflate your literacy index.
Does this cover econometrics, international trade models, or advanced policy?
This screener stays at shared intro topics: scarcity, basic markets, headline macro terms, and study limits. Advanced tracks belong in dedicated courses and problem sets.
Who reviewed this quiz?
Dr. James Whitfield, PhD reviewed the educational framing, study not finance limits, and result explanations. See our editorial policy for review standards.
Reviewed by