undefined
This analytic vs big-picture scale (AHS) quiz screens detail-first analytic habits alongside big-picture spectrum layers inspired by Nisbett cultural cognition themes and workplace thinking-style education. Twenty-two agree-disagree items map to four analytic domains and four big-picture layers. Each item also maps to a fear-of-intimacy stack layer when admitting confusion feels risky.
Detail focus
Line-by-line reading, typo spotting, and discomfort starting before specs are clear.
Logical parsing
Premise-conclusion breakdown, if-then reasoning, and whiteboard gap finding.
Categorization
Labeled buckets, tidy tags, and tables when topics feel chaotic.
Linear reasoning
Fixed step order, Gantt trust, and numbered how-to explanations.
How it works
Three steps from first question to your dual-spectrum report with intimacy stack.
Answer 22 agreement items
Rate how much you agree with each statement. You click Next after each answer.
Items map to dual spectrum
Your answers accumulate analytic domain percentages, big-picture spectrum layers, and intimacy stack layers.
View indices and triple charts
Results show analytic pull index, big-picture processing index, three bar charts, and a band label.
Take the analytic vs big-picture scale quiz
Answer 22 original items about analytic versus big-picture processing. Your responses produce dual indices, three chart blocks, and a band label for reflection.
Opens in a focused modal. No account required. Results stay on screen.
undefined
Your analytic pull index is the normalized total across all items on a 0 to 100 scale. Big-picture processing index is 100 minus analytic pull. Higher analytic scores mean more agreement with detail-first and linear items on this screener.
| Band | Index range | Typical reading |
|---|---|---|
| More Big-Picture-Leaning Processing | 0 to 35 | Lower analytic pull; stronger big-picture spectrum endorsement |
| Mixed Analytic-Big-Picture Blend | 36 to 65 | Blend of detail-first and big-picture habits |
| More Analytic-Leaning Processing | 66 to 100 | Higher analytic pull on detail, logic, categories, and linear plans |
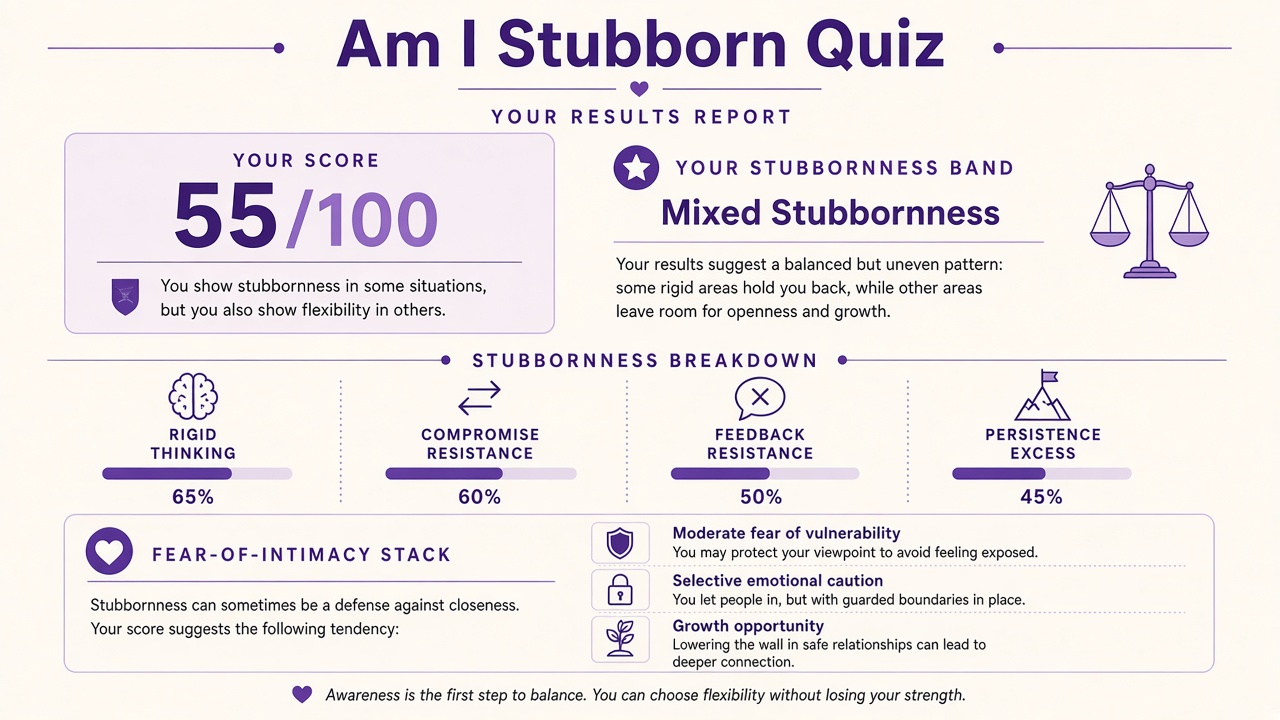
What your AHS quiz report looks like
After all 22 items, you get analytic and big-picture indices, band label, analytic domain bars, big-picture spectrum bars, and a fear-of-intimacy stack chart.
What this quiz can and cannot tell you
Can tell you
- How strongly analytic versus big-picture habits showed up in this self-report screener
- Analytic pull and big-picture processing indices from 0 to 100 plus intimacy stack
- Which analytic domain and big-picture layer feel strongest in your answers
- A starting point for team communication or coursework reflection
Cannot tell you
- Clinical cognitive style batteries or neuropsychology diagnoses
- Hiring decisions or proof of job-fit thinking style
- Proof that one processing style is smarter than the other
- Replacement for validated Hermann Brain Dominance or Kirton KAI instruments
Why people search analytic vs big-picture scale quizzes
People search analytic vs big-picture scale when teams misread each other as too picky or too vague. Cross-cultural cognition research by Richard Nisbett contrasted detail-focused analytic habits with context-first big-picture habits in reasoning tasks. This AHS-inspired screener turns those themes into agree-disagree domains with honest limits.
Unlike single-score trivia, this quiz reports analytic domains, big-picture spectrum layers, and a fear-of-intimacy stack when competence feels socially risky. Compare with our am I sensing or intuitive quiz for MBTI-adjacent framing or left brain right brain test for hemisphere metaphor siblings.
| The Quiz Hub test | What it adds |
|---|---|
| Am I sensing or intuitive quiz | Sensing pull versus intuitive spectrum with dual charts |
| Left brain right brain test | Hemisphere metaphor screener on the hub |
| Analyzing arguments quiz | Claim-evidence and fallacy self-report screener |
| This quiz | Dual analytic and big-picture spectrum with intimacy stack, not hemisphere trivia alone. |
Retake after role changes if you want to track self-report shifts. Use results to negotiate how your team splits specs versus vision, not to label people good or bad thinkers.
Analytic vs Big-Picture Scale Quiz FAQ
What does the analytic vs big-picture scale (AHS) quiz measure?
Twenty-two agree-disagree items ask how much you endorse detail focus, logical parsing, categorization, and linear reasoning alongside big-picture spectrum layers for big-picture view, contextual flexibility, intuition trust, and relational wholes. Each item maps to a fear-of-intimacy stack layer. You receive an analytic pull index from 0 to 100 plus a big-picture processing index.
Does a higher analytic pull index mean I am smarter?
No. Higher analytic pull means you endorsed more detail-first and linear items on this self-report screener. Intelligence tests use different standardized methods. Big-picture processing is not lower intelligence on this quiz.
What is the fear-of-intimacy stack on this quiz?
The stack chart shows vulnerability pull-back, trust hesitation, self-disclosure limits, and closeness anxiety layers that may pair with hiding confusion or performing competence in groups.
How is this different from left brain right brain tests?
Left brain right brain tests use hemisphere metaphor framing. This AHS quiz uses analytic versus big-picture processing domains inspired by cultural cognition research without claiming literal brain sides.
Can teams use this quiz for hiring?
No. This is a self-report reflection tool with stated limits. Hiring should use validated job-related assessments and structured interviews, not recreational quizzes.
Who reviewed this content?
Dr. James Whitfield, reviewed the test framing and result explanations. See our editorial policy for review standards.
Reviewed by